What is PMP?
PMP AWARxE is the technology that provides state government agencies with accurate, near real-time data that is compliant with their regulations—providing a complete picture of controlled substance use.
PMP AWARxE benefits physicians and pharmacists by functioning directly in the clinical workflows of their electronic health records and pharmacy management systems, empowering them to make more confident prescribing and dispensing decisions. Providers can even intervene and stop potential substance misuse when troubling patterns arise.
Learn more about PMP AWARxE HERE.
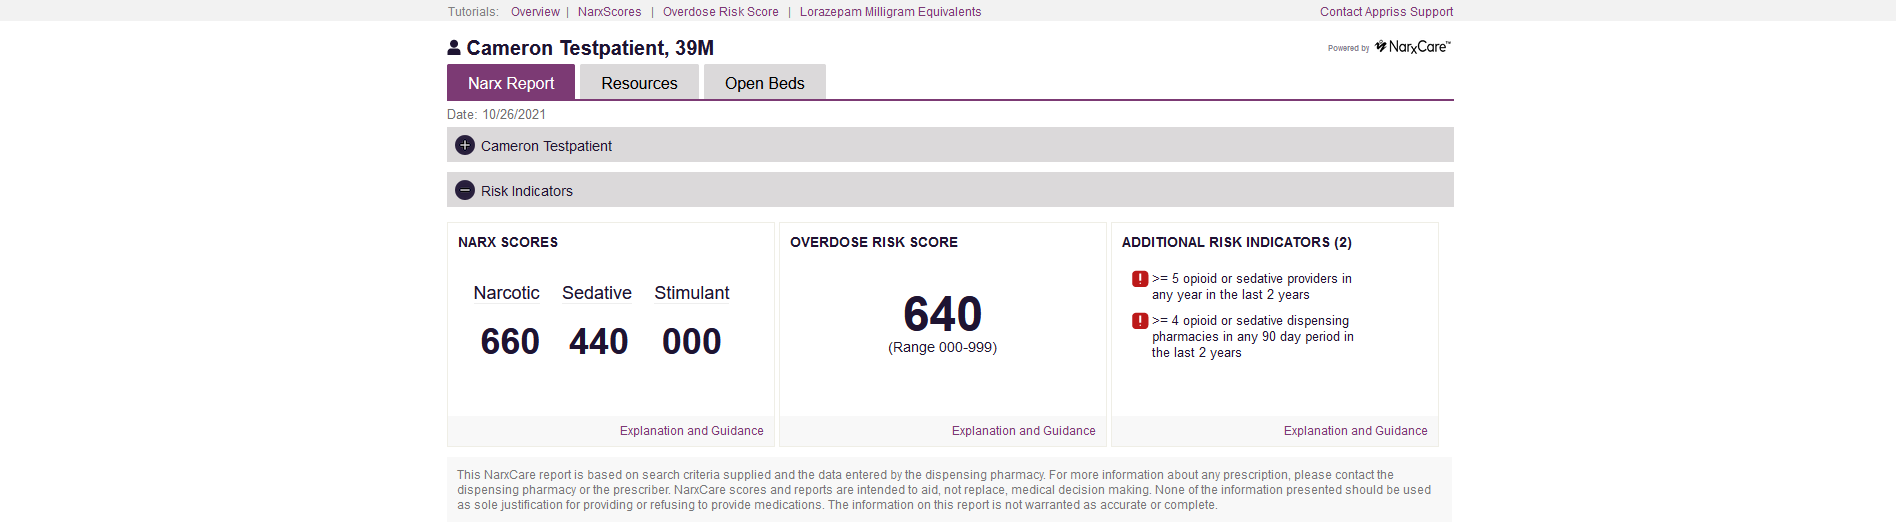
Risk Indicators:
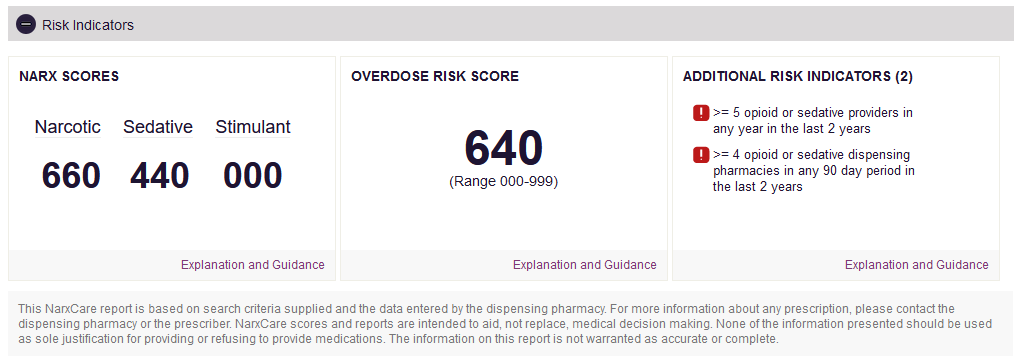
NARX Scores:
NarxCare is a robust analytics risk scoring application that helps prescribers and dispensers analyze controlled substance data from PDMPs, assess overdose risk, and manage substance use disorder—resulting in more informed prescribing and dispensing decisions.
Learn more about Narx Scores HERE.
Overdose Risk Score:
The overdose risk score is a predictive score for unintentional overdose death. It often correlates with the Narx Scores. When differences exist, it is often because of different weighting associated with those elements contributing to overdose risk. For instance, pharmacy usage is more predictive of overdose death than MED and therefore carries more
weight in the ORS than its weight in calculating a Narx Score. Also, particular decreases in use may increase the risk of death.
Additional Risk Indicators:
ARIs within the PMP data are predictors of adverse outcomes, specifically
unintentional overdose death. The PDMP based ARIs used by NarxCare were studied alongside the NarxCare Narcotic score as a predictor of unintentional overdose death and was found to have statistically equivalent OR when all three variables are present simultaneously (functionally equivalent to a Narcotic Score of 650). A history of the previous overdose is associated with a high rate of repeat overdose (8% – 17% depending on continued opioid usage ranging from zero to high). When present, this indicator will be displayed at the top of the additional risk indicator section, along with the number of previous overdoses recorded in parentheses.
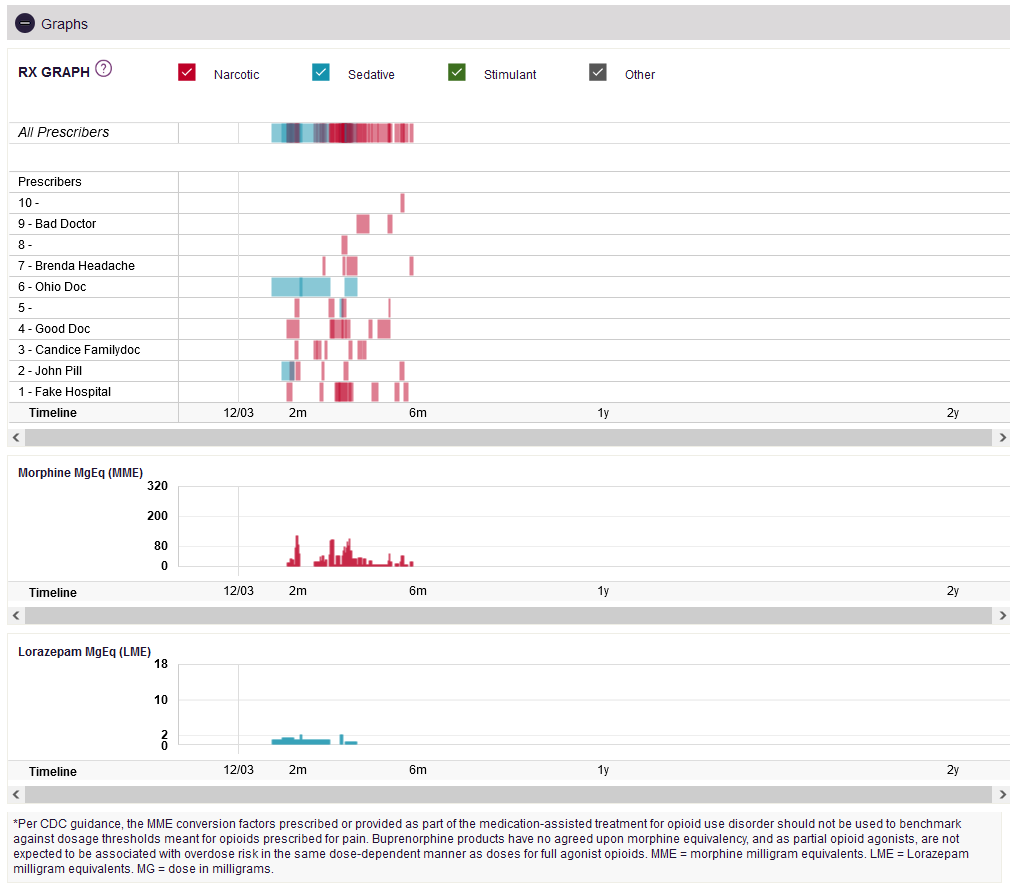
Graphs:
The Graph group visually shows the patient’s prescription history from various prescribers. Narcotics, Sedatives, and Stimulants are highlighted to make them stand out from the patient’s other prescriptions.
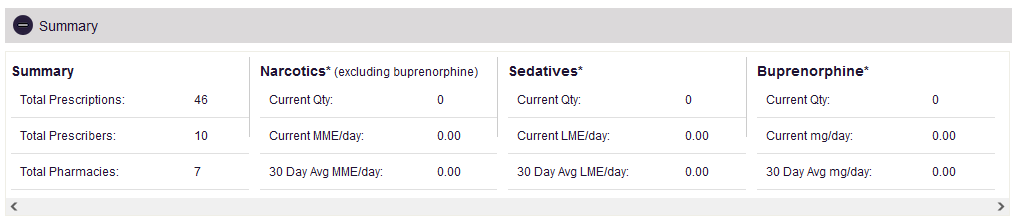
Summary:
The summary group shows the data in the graph group in a compact table.
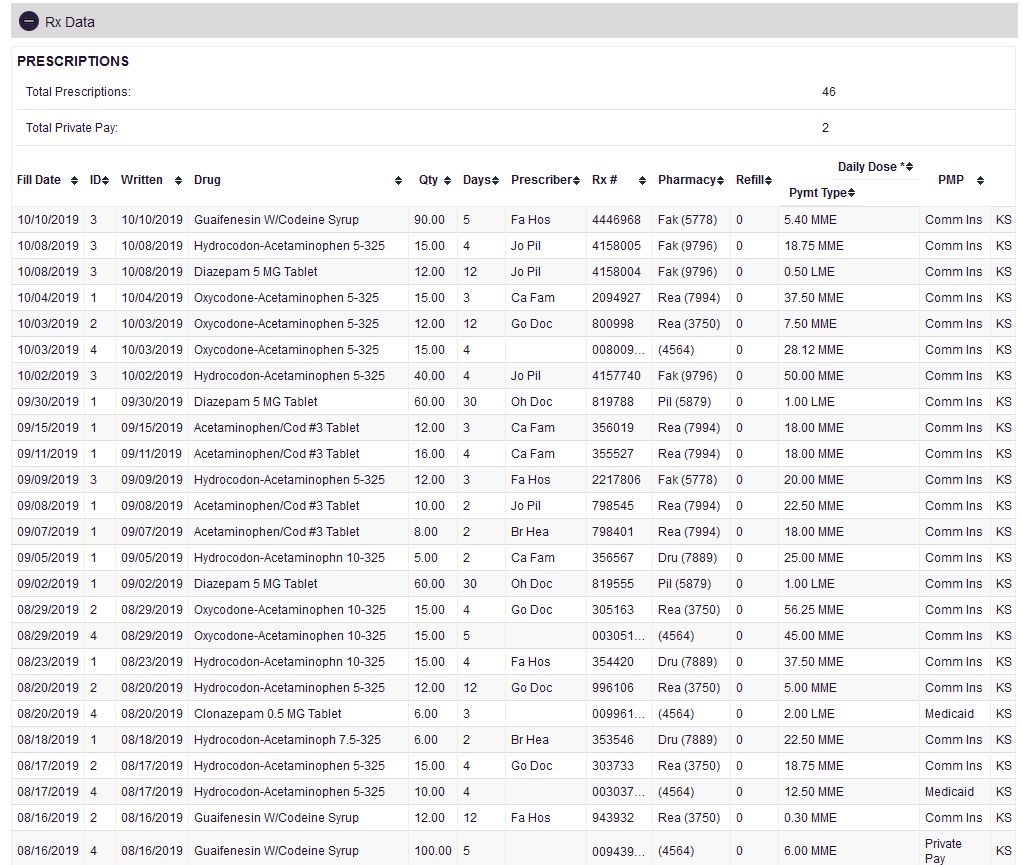
Rx Data:
Prescriptions:
The Prescriptions data table shows all prescriptions that have been filled for the patient, including their fill and written dates, dispense quantity, and prescriber.
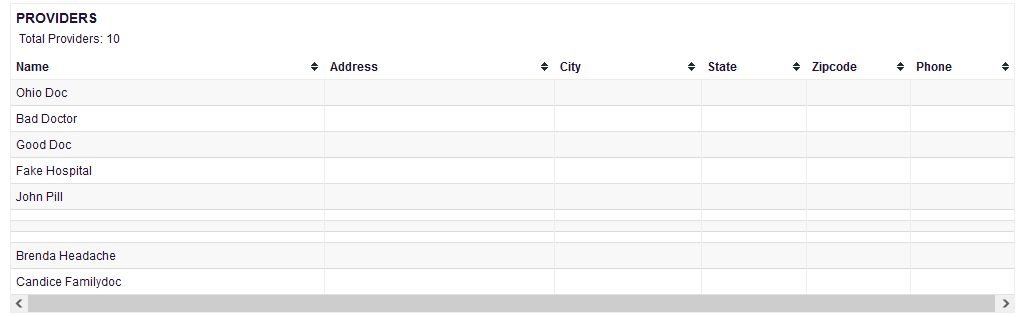
Providers:
The Providers data table lets you view every prescriber who has prescribed for the patient.
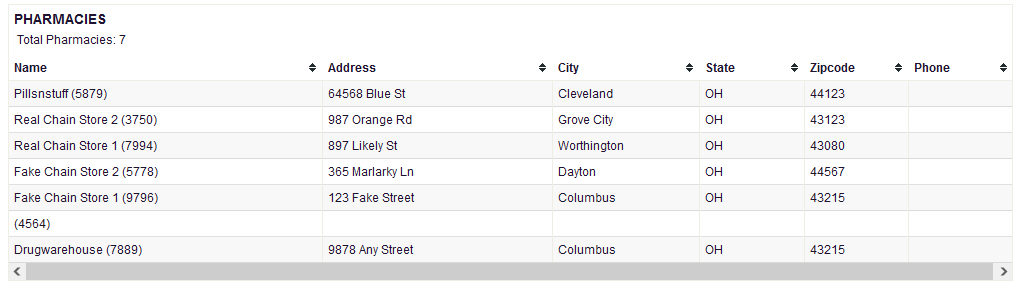
Pharmacies:
The Pharmacies data table shows every pharmacy that has filled a prescription for the patient.